
Thursday, November 29, 2018
The 1% in America
These two charts show U.S. wealth distribution by trillions of dollars (L) and by percentage (R). If the present trend continues, within three years the wealthiest 1% of Americans will own over half the country's wealth, and half the population will own nothing, zero, nada, zip. It'll be 1929 again. We already have a homeless problem. Will we have children begging in the streets, debtors' prisons and families living like gypsies in their twenty-year-old minivans and SUVs?

Saturday, May 12, 2018
Recession Coming in Q1 2019
Cycling Economies
In 1999, I began saying the tech bubble would eventually spark a recession. Timing was unclear because stock bubbles can blow way bigger than we can imagine. Then the yield curve inverted, and I said recession was certain. I was early in that call, but it happened.
In late 2006, I began highlighting the subprime crisis, and subsequently the yield curve again inverted, necessitating another recession call. Again, I was early, but you see the pattern.
Now let’s fast-forward to today. Here’s what I said last week that drew so much interest.
Peter [Boockvar] made an extraordinarily cogent comment that I’m going to use from now on: “We no longer have business cycles, we have credit cycles.”
For those who don’t know Peter, he is the CIO of Bleakley Advisory Group and editor of the excellent Boock Report. Let’s cut that small but meaty sound bite into pieces.
What do we mean by “business cycle,” exactly? Well, it looks something like this:
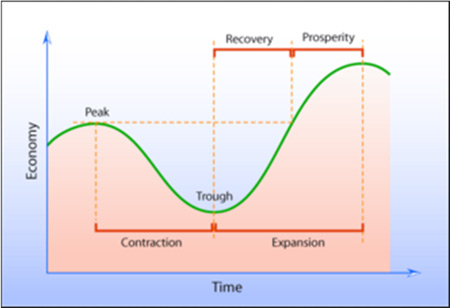
A growing economy peaks, contracts to a trough (what we call “recession”), recovers to enter prosperity, and hits a higher peak. Then the process repeats. The economy is always in either expansion or contraction.
Economists disagree on the details of all this. Wikipedia has a good overview of the various perspectives, if you want to geek out. The high-level question is why economies must cycle at all. Why can’t we have steady growth all the time? Answers vary. Whatever it is, periodically something derails growth and something else restarts it.
This pattern broke down in the last decade. We had an especially painful contraction followed by an extraordinarily weak expansion. GDP growth should reach 5% in the recovery and prosperity phases, not the 2% we have seen. Peter blames the Federal Reserve’s artificially low interest rates. Here’s how he put it in an April 18 letter to his subscribers.
To me, it is a very simple message being sent. We must understand that we no longer have economic cycles. We have credit cycles that ebb and flow with monetary policy. After all, when the Fed cuts rates to extremes, its only function is to encourage the rest of us to borrow a lot of money and we seem to have been very good at that. Thus, in reverse, when rates are being raised, when liquidity rolls away, it discourages us from taking on more debt. We don’t save enough.
This goes back farther than 2008. The Greenspan Fed pushed rates abnormally low in the late 1990s even though the then-booming economy needed no stimulus. That was in part to provide liquidity to a Y2K-wary public and partly in response to the 1998 market turmoil, but they were slow to withdraw the extra cash. Bernanke was again generous to borrowers in the 2000s, contributing to the housing crisis and Great Recession. We’re now 20 years into training people (and businesses) that running up debt is fun and easy… and they’ve responded.
But over time, debt stops stimulating growth. Over this series, we will see that it takes more debt accumulation for every point of GDP growth, both in the US and elsewhere. Hence, the flat-to-mild “recovery” years. I’ve cited academic literature via my friend Lacy Hunt that debt eventually becomes a drag on growth.
Debt-fueled growth is fun at first but simply pulls forward future spending, which we then miss. Now we’re entering the much more dangerous reversal phase in which the Fed tries to break the debt addiction. We all know that never ends well.
So, Peter’s point is that a Fed-driven credit cycle now supersedes the traditional business cycle. Since debt drives so much GDP growth, its cost (i.e. interest rates) is the main variable defining where we are in the cycle. The Fed controls that cost—or at least tries to—so we all obsess on Fed policy. And rightly so.
Among other effects, debt boosts asset prices. That’s why stocks and real estate have performed so well. But with rates now rising and the Fed unloading assets, those same prices are highly vulnerable. An asset’s value is what someone will pay for it. If financing costs rise and buyers lack cash, the asset price must fall. And fall it will. The consensus at my New York dinner was recession in the last half of 2019. Peter expects it sooner, in Q1 2019.
If that’s right, financial market fireworks aren’t far away.
Corporate Debt Disaster
In an old-style economic cycle, recessions triggered bear markets. Economic contraction slowed consumer spending, corporate earnings fell, and stock prices dropped. That’s not how it works when the credit cycle is in control. Lower asset prices aren’t the result of a recession. They cause the recession. That’s because access to credit drives consumer spending and business investment. Take it away and they decline. Recession follows.
If some of this sounds like the Hyman Minsky financial instability hypothesis I’ve described before, you’re exactly right. Minsky said exuberant firms take on too much debt, which paralyzes them, and then bad things start happening. I think we’re approaching that point.
The last “Minsky Moment” came from subprime mortgages and associated derivatives. Those are getting problematic again, but I think today’s bigger risk is the sheer amount of corporate debt, especially high-yield bonds that will be very hard to liquidate in a crisis.
Corporate debt is now at a level that has not ended well in past cycles. Here’s a chart from Dave Rosenberg:
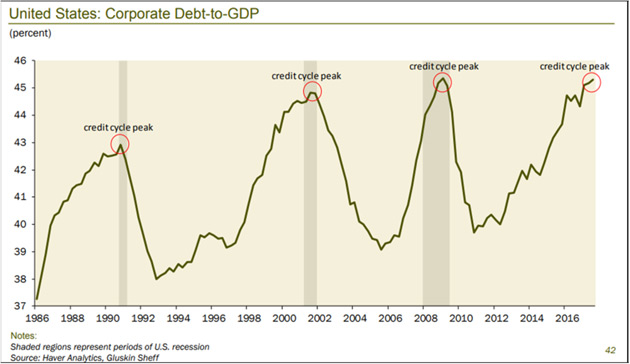
Source: Gluskin Sheff
The Debt/GDP ratio could go higher still, but I think not much more. Whenever it falls, lenders (including bond fund and ETF investors) will want to sell. Then comes the hard part: to whom?
You see, it’s not just borrowers who’ve become accustomed to easy credit. Many lenders assume they can exit at a moment’s notice. One reason for the Great Recession was so many borrowers had sold short-term commercial paper to buy long-term assets. Things got worse when they couldn’t roll over the debt and some are now doing exactly the same thing again, except in much riskier high-yield debt. We have two related problems here.
- Corporate debt and especially high-yield debt issuance has exploded since 2009.
- Tighter regulations discouraged banks from making markets in corporate and HY debt.
Both are problems but the second is worse. Experts tell me that Dodd-Frank requirements have reduced major bank market-making abilities by around 90%. For now, bond market liquidity is fine because hedge funds and other non-bank lenders have filled the gap. The problem is they are not true market makers. Nothing requires them to hold inventory or buy when you want to sell. That means all the bids can “magically” disappear just when you need them most. These “shadow banks” are not in the business of protecting your assets. They are worried about their own profits and those of their clients.
Gavekal’s Louis Gave wrote a fascinating article on this last week titled, “The Illusion of Liquidity and Its Consequences.” He pulled the numbers on corporate bond ETFs and compared it to the inventory trading desks were holding—a rough measure of liquidity.
Louis found dealer inventory is not remotely enough to accommodate the selling he expects as higher rates bite more.
Louis found dealer inventory is not remotely enough to accommodate the selling he expects as higher rates bite more.
We now have a corporate bond market that has roughly doubled in size while the willingness and ability of bond dealers to provide liquidity into a stressed market has fallen by more than -80%. At the same time, this market has a brand-new class of investors, who are likely to expect daily liquidity if and when market behavior turns sour. At the very least, it is clear that this is a very different corporate bond market and history-based financial models will most likely be found wanting.
The “new class” of investors he mentions are corporate bond ETF and mutual fund shareholders. These funds have exploded in size (high yield alone is now around $2 trillion) and their design presumes a market with ample liquidity. We barely have such a market right now, and we certainly won’t have one after rates jump another 50–100 basis points.
Worse, I don’t have enough exclamation points to describe the disaster when high-yield funds, often purchased by mom-and-pop investors in a reach for yield, all try to sell at once, and the funds sell anything they can at fire-sale prices to meet redemptions.
In a bear market you sell what you can, not what you want to. We will look at what happens to high-yield funds in bear markets in a later letter. The picture is not pretty.
To make matters worse, many of these lenders are far more leveraged this time. They bought their corporate bonds with borrowed money, confident that low interest rates and defaults would keep risks manageable. In fact, according to S&P Global Market Watch, 77% of corporate bonds that are leveraged are what’s known as “covenant-lite.” We’ll discuss more later in this series, but the short answer is that the borrower doesn’t have to repay by conventional means. Sometimes they can even force the lender to take more debt. In an odd way, some of these “covenant-lite” borrowers can actually “print their own money.”
Somehow, lenders thought it was a good idea to buy those bonds. Maybe that made sense in good times. In bad times? It can precipitate a crisis. As the economy enters recession, many companies will lose their ability to service debt, especially now that the Fed is making it more expensive to roll over—as multiple trillions of dollars will need to do in the next few years. Normally this would be the borrowers’ problem, but covenant-lite lenders took it on themselves.
The macroeconomic effects will spread even more widely. Companies that can’t service their debt have little choice but to shrink. They will do it via layoffs, reducing inventory and investment, or selling assets. All those reduce growth and, if widespread enough, lead to recession.
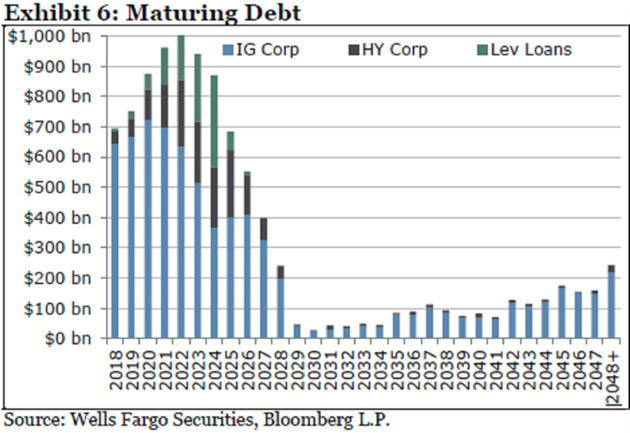
Let’s look at this data and troubling chart from Bloomberg:
Companies will need to refinance an estimated $4 trillion of bonds over the next five years, about two-thirds of all their outstanding debt, according to Wells Fargo Securities. This has investors concerned because rising rates means it will cost more to pay for unprecedented amounts of borrowing, which could push balance sheets toward a tipping point. And on top of that, many see the economy slowing down at the same time the rollovers are peaking.
“If more of your cash flow is spent into servicing your debt and not trying to grow your company, that could, over time—if enough companies are doing that—lead to economic contraction,” said Zachary Chavis, a portfolio manager at Sage Advisory Services Ltd. in Austin, Texas. “A lot of people are worried that could happen in the next two years.”
The problem is that much of the $2 trillion in bond ETF and mutual funds isn’t owned by long-term investors who hold maturity. When the herd of investors calls up to redeem, there will be no bids for their “bad” bonds. But they’re required to pay redemptions, so they’ll have to sell their “good” bonds. Remaining investors will be stuck with an increasingly poor-quality portfolio, which will drop even faster. Wash, rinse, repeat. Those of us with a little gray hair have seen this before, but I think the coming one is potentially biblical in proportion.

Blowing the Whistle
As you can tell, this is a multifaceted problem. I will dig deeper into the specifics in the coming weeks. The numbers seem unbelievable. I truly think we are headed to a staggering credit crisis.
I began this letter describing the coming events as a train wreck. That comparison came up when my colleague Patrick Watson and I were on the phone this week, planning this series of letters. Patrick and his beautiful wife Grace had just come back from Tennessee, and he told me about visiting the Casey Jones birthplacemuseum in Jackson.
For those who don’t know the story or haven’t heard the songs, Casey Jones was a talented young railroad engineer in the late 1800s. On April 30, 1900, Casey Jones was going at top speed when his train tragically overtook a stopped train that wasn’t supposed to be there.
Traveling at 75 miles per hour, Jones ordered his young fireman to jump, pulled the brakes hard, and blew the train whistle, warning his passengers and the other train. Later investigations found he had slowed it to 35 mph before impact. Everyone on both trains survived… except Casey Jones.
His heroic death made Jones a folk hero to this day. Many songs told the story and even the Grateful Dead and AC/DC paid tribute decades later. (Trivia: He actually tuned his train whistle with six different tubes to make a unique whippoorwill sound. So, when people heard his train whistle, they knew it was Casey Jones.)
Right now, the US economy is kind of like that train: speeding ahead with the Fed only slowly removing the fuel it shouldn’t have loaded in the first place and passengers just hoping to reach our destination on time. Unfortunately, we don’t have a reliable Casey Jones at the throttle. We’re at the mercy of central bankers and politicians who aren’t looking ahead. They can’t simply turn the steering wheel. We are stuck on this track and will go where it takes us.
Next week, we’ll talk about the sequence of how the next debt crisis will arise, how it triggers a recession, and then $2 trillion of deficits in the US and rising debt all over the world. Which just increases pressures on interest rates and lending. And reduces growth. It is not a virtuous cycle.
Tuesday, May 31, 2016
Rothschilds Prove that Elite Bankers Rule the World
Rothschilds Prove that Elite Bankers Rule the World —
Establish Billionaire Tax Haven INSIDE America

READ THE ENTIRE ARTICLE HERE
Establish Billionaire Tax Haven INSIDE America

READ THE ENTIRE ARTICLE HERE
Friday, May 20, 2016
The Average American’s Retirement Savings By Age -- And Where So Many Go Wrong
Would you like to know if you're on track for a financially secure retirement? This short piece will give you an excellent idea... complete with two easily readable graphs and a table. Trust me, it's worth five minutes of your time.
LINK TO ENTIRE ARTICLE
LINK TO ENTIRE ARTICLE
Wednesday, May 4, 2016
The Savings Rate Also Rises... By Michael K. Farr, May 3, 2016
Late last week we learned that Personal Income rose at a respectable pace of +0.4% in March, exceeding the consensus estimate of +0.3%. As has become a recurring theme, though, the pace of consumer spending was unable to keep up with the growth in income. Personal Spending rose just +0.1% in March, below the consensus estimate of +0.2%. The net effect? The savings rate rose again, this time to a 13-month high of 5.4%. For the full first quarter of 2016, the savings rate of 5.2% matched the highest level since the fourth quarter of 2012.
We have been talking about the likelihood of a higher savings rate for several years, and we continue to believe that further increases will be a significant drag on economic growth for at least the next several years. Why? Well the quickest explanation is that leading up the financial crisis, the savings rate had fallen far too low relative to historical averages. Since World War Two, the US consumer has saved an average of 8.7% of his Disposable Personal Income (DPI) on an annual basis. That rate fell to a low of 2.6% in 2005 but has since rebounded to 5.1% in 2015 - still well below the long-term average. So the recent increases in saving may simply be that the consumer is compensating for years of profligate spending and under-saving.

But simply showing that the savings rate is low relative to history is not a great explanation for why we think the savings rate will continue rising from here. The consumer savings rate can be affected by a number of different variables, including income levels, unemployment rates, housing prices, stock prices, inflation rates, consumer confidence, lending standards (access to credit), gas prices, interest rates, etc. Given that many of these variables have been supportive of consumer spending in recent years, most economists have been somewhat confounded by the recent increases in the savings rate. For example, the unemployment rate has been cut in half, incomes have risen, stock prices have tripled since March, 2009, the housing market has rebounded nicely, inflation is low, confidence has rebounded, lending standards have loosened, and gas prices and interest rates are very low. There is not much in these indicators that would "spook" consumers into saving more. So why the sudden urge to put more aside for a rainy day?
In our view, the most logical explanation is that many of the economic indicators cited above are not an accurate depiction of the typical middle-class family. Most notably, middle-class incomes have risen at a much slower pace than the cost of non-discretionary expenditures, such as health care, education, child care, housing, and yes, saving for retirement (the cost of which goes up as asset prices rise and expected future returns go down). The squeezing of the middle class has been a decades-long trend that shows little sign of reversing. The average American is in precarious financial condition, without the means to address a minor short-term financial emergency much less fund a 30-year retirement. The cover story in this month's The Atlantic magazine ("The Secret Shame of Middle-Class Americans", by Neal Gabler) is just the latest in a long series of news pieces that have shed light on this issue. The entire article can be found at this link:http://www.theatlantic.com/magazine/archive/2016/05/my-secret-shame/476415/. But let me offer some quotations taken directly from the article:
As always when I discuss this topic, I ask you to please not mistake this as a political commentary. I am simply trying to shed additional light on the problem as it relates to our future economic growth prospects. A little less than 70% of our economy is comprised of consumer spending, so the consumer's financial condition is of utmost importance. Possible solutions to the problem are outside the scope of this Market Commentary, but I'll give you a clue. Congress...get your act together!
Peace,
Michael
FarrMiller.com
We have been talking about the likelihood of a higher savings rate for several years, and we continue to believe that further increases will be a significant drag on economic growth for at least the next several years. Why? Well the quickest explanation is that leading up the financial crisis, the savings rate had fallen far too low relative to historical averages. Since World War Two, the US consumer has saved an average of 8.7% of his Disposable Personal Income (DPI) on an annual basis. That rate fell to a low of 2.6% in 2005 but has since rebounded to 5.1% in 2015 - still well below the long-term average. So the recent increases in saving may simply be that the consumer is compensating for years of profligate spending and under-saving.

In our view, the most logical explanation is that many of the economic indicators cited above are not an accurate depiction of the typical middle-class family. Most notably, middle-class incomes have risen at a much slower pace than the cost of non-discretionary expenditures, such as health care, education, child care, housing, and yes, saving for retirement (the cost of which goes up as asset prices rise and expected future returns go down). The squeezing of the middle class has been a decades-long trend that shows little sign of reversing. The average American is in precarious financial condition, without the means to address a minor short-term financial emergency much less fund a 30-year retirement. The cover story in this month's The Atlantic magazine ("The Secret Shame of Middle-Class Americans", by Neal Gabler) is just the latest in a long series of news pieces that have shed light on this issue. The entire article can be found at this link:http://www.theatlantic.com/magazine/archive/2016/05/my-secret-shame/476415/. But let me offer some quotations taken directly from the article:
- The Fed asked respondents (to a national survey it conducted) how they would pay for a $400 emergency. The answer: 47 percent of respondents said that either they would cover the expense by borrowing or selling something, or they would not be able to come up with the $400 at all.
- Two reports published last year by the Pew Charitable Trusts found, respectively, that 55 percent of households didn't have enough liquid savings to replace a month's worth of lost income, and that of the 56 percent of people who said they'd worried about their finances in the previous year, 71 percent were concerned about having enough money to cover everyday expenses.
- Median net worth has declined steeply in the past generation-down 85.3 percent from 1983 to 2013 for the bottom income quintile, down 63.5 percent for the second-lowest quintile, and down 25.8 percent for the third, or middle, quintile. According to research funded by the Russell Sage Foundation, the inflation-adjusted net worth of the typical household, one at the median point of wealth distribution, was $87,992 in 2003. By 2013, it had declined to $54,500, a 38 percent drop. And though the bursting of the housing bubble in 2008 certainly contributed to the drop, the decline for the lower quintiles began long before the recession-as early as the mid-1980s, Wolff says.
- ...the study by Lusardi, Tufano, and Schneider found that nearly one-quarter of households making $100,000 to $150,000 a year claim not to be able to raise $2,000 in a month.
- Real hourly wages-that is, wage rates adjusted for inflation-peaked in 1972; since then, the average hourly wage has essentially been flat. (These figures do not include the value of benefits, which has increased.)
- Though household incomes rose dramatically from 1967 to 2014 for the top quintile (ie, the highest earning one-fifth), and more dramatically still for the top 5 percent, incomes in the bottom three quintiles rose much more gradually: only 23.2 percent for the middle quintile, 13.1 percent for the second-lowest quintile, and 17.8 percent for the bottom quintile. That is over a period of 47 years! But even that minor growth is somewhat misleading. The peak years for income in the bottom three quintiles were 1999 and 2000; incomes have declined overall since then-down 6.9 percent for the middle quintile, 10.8 percent for the second-lowest quintile, and 17.1 percent for the lowest quintile.
- A 2014 analysis by USA Today concluded that the American dream, defined by factors that generally corresponded to the Commerce Department's middle-class benchmarks, would require an income of just more than $130,000 a year for an average family of four. Median family income in 2014 was roughly half that.
- The American Psychological Association conducts a yearly survey on stress in the United States. The 2014 survey-in which 54 percent of Americans said they had just enough or not enough money each month to meet their expenses-found money to be the country's No. 1 stressor.
- A 2014 New York Times poll found that only 64 percent of Americans said they believed in the American dream-the lowest figure in nearly two decades.
As always when I discuss this topic, I ask you to please not mistake this as a political commentary. I am simply trying to shed additional light on the problem as it relates to our future economic growth prospects. A little less than 70% of our economy is comprised of consumer spending, so the consumer's financial condition is of utmost importance. Possible solutions to the problem are outside the scope of this Market Commentary, but I'll give you a clue. Congress...get your act together!
Peace,
Michael
FarrMiller.com
Wednesday, March 11, 2015
The Surging U.S. Dollar - by Michael K Farr Mar. 11, 2015
The Surging U.S. Dollar - by Michael K Farr
Earnings estimates are coming down. In fact, the aggregate earnings estimate for the S&P 500 has dropped roughly 10% since late 2014. According to data from the Standard & Poor's web site, S&P 500 operating earnings are now expected to grow just 5% compared to the estimate for 2014. If the current trend of downward revisions continues, there may be no earnings growth at all this year when it's all said and done. Negative revisions to earnings expectations are not typical of an economy that is gaining strength. So what is going on?
There are several factors weighing on earnings expectations, and therefore stock prices. One factor that is gaining increased attention is the dramatic rise in the value of the dollar. The US Dollar Index (DXY), which measures the value of the dollar against a basket of major world currencies, is currently hovering at a 12-year high after appreciating around 23% since mid-2014. The implications of a sharply higher dollar are many. So let's dig into this further and see if we can't clarify what's going on.
The most obvious problem with a soaring dollar is that US companies that generate revenue outside the US are at a competitive disadvantage compared to their foreign competitors. The implicit assumptions here are that 1) US multinationals do not have effective currency hedging programs, and 2) the expenses at these multinationals are incurred in US dollars. If either of these is untrue, specific companies may have reduced at least some of their currency exposure. In any event, compounding the problem for multinationals is the fact that earnings will take a hit as they are translated back into US dollars in each reporting period. Estimates vary widely, but given that at least 30% (and perhaps well over 40%) of S&P 500 revenue is derived outside the US, the dollar's strength is having a big effect on profitability for the index at large.
A second effect from a higher dollar is that commodities, which are largely traded in US dollars, are falling in price. We have already seen the fallout that plunging oil prices are having on the Energy sector, which now represents just 8% of the total S&P 500 index. According to data from S&P, earnings for S&P 500 Energy companies are set to fall over 50% in 2015 as a result of the drop in black gold. And while a surge in supply is responsible for much of the big decrease in oil prices, tepid demand and the stronger dollar are also certainly factors as well. The dollar's strength also translates to weakness in other commodity prices, putting earnings in the Materials sector, for example, at risk of further negative revisions.

A higher dollar also has implications for US economic growth. Exports add to domestic GDP, while imports subtract. As the dollar falls, imports become cheaper relative to domestically produced goods and services. In 2014, an increase in the trade deficit subtracted 23 basis points from GDP growth. Most believe that figure will go much higher in 2015. Moreover, the rapid growth in imports associated with the dollar strength results in the US effectively "importing deflation" at a time when the Fed is trying to generate more inflation. In other words, the strong dollar is complicating matters for the Fed.
Where is much of the recent earnings growth coming from? Corporate buybacks. According to a March 4 article in The Wall Street Journal, "In the six full years following and including the financial-crisis nadir - so, 2009 through 2014 - a net of $41.2 billion has gone into equity funds, according to data from Lipper Funds. Meanwhile, in the first three quarters of 2014 alone, corporate buybacks rose 27%, to $567.2 billion." This is a stunning statistic. The article goes on to say that "buyback authorizations in February, at $118.32 billion, were the strongest for any February on record, according to data from Birinyi Associates." Should investors pay up for earnings growth generated through buybacks? So far they have, but this game of financial engineering is likely to lose its luster if for no other reason than stocks are no longer cheap. All else equal, buybacks are set to be meaningfully less accretive when executed at dramatically higher prices.
We've argued that earnings quality is a factor that has been underappreciated by investors during the course of this bull market. Corporate profit growth has benefited from several unsustainable factors, and margins that are running some 50% above long-term averages. We have also argued that there cannot be a complete "decoupling" between the US and the rest of the world. It appears as though the market is beginning to catch on to these notions. We continue to believe it makes most sense to own high-quality, conservative large-cap companies with fortress balance sheets and superior management teams. There is no wisdom in crawling onto the thinner branches if a storm is coming!
Peace,
Michael
http://farrmiller.com/
Earnings estimates are coming down. In fact, the aggregate earnings estimate for the S&P 500 has dropped roughly 10% since late 2014. According to data from the Standard & Poor's web site, S&P 500 operating earnings are now expected to grow just 5% compared to the estimate for 2014. If the current trend of downward revisions continues, there may be no earnings growth at all this year when it's all said and done. Negative revisions to earnings expectations are not typical of an economy that is gaining strength. So what is going on?
There are several factors weighing on earnings expectations, and therefore stock prices. One factor that is gaining increased attention is the dramatic rise in the value of the dollar. The US Dollar Index (DXY), which measures the value of the dollar against a basket of major world currencies, is currently hovering at a 12-year high after appreciating around 23% since mid-2014. The implications of a sharply higher dollar are many. So let's dig into this further and see if we can't clarify what's going on.
The most obvious problem with a soaring dollar is that US companies that generate revenue outside the US are at a competitive disadvantage compared to their foreign competitors. The implicit assumptions here are that 1) US multinationals do not have effective currency hedging programs, and 2) the expenses at these multinationals are incurred in US dollars. If either of these is untrue, specific companies may have reduced at least some of their currency exposure. In any event, compounding the problem for multinationals is the fact that earnings will take a hit as they are translated back into US dollars in each reporting period. Estimates vary widely, but given that at least 30% (and perhaps well over 40%) of S&P 500 revenue is derived outside the US, the dollar's strength is having a big effect on profitability for the index at large.
A second effect from a higher dollar is that commodities, which are largely traded in US dollars, are falling in price. We have already seen the fallout that plunging oil prices are having on the Energy sector, which now represents just 8% of the total S&P 500 index. According to data from S&P, earnings for S&P 500 Energy companies are set to fall over 50% in 2015 as a result of the drop in black gold. And while a surge in supply is responsible for much of the big decrease in oil prices, tepid demand and the stronger dollar are also certainly factors as well. The dollar's strength also translates to weakness in other commodity prices, putting earnings in the Materials sector, for example, at risk of further negative revisions.
Source: Bloomberg
A rapidly rising dollar also creates significant systemic risks in the capital markets. The Fed's aggressive monetary policy created "easy money" by pushing down interest rates to very low levels. Higher-risk issuers in emerging markets and within the Energy sector found the interest rates too attractive to ignore. Now that the Fed is set to raise rates and the dollar is rising, those same bond issuers may find themselves in trouble. Issuers in emerging markets who generate revenues in their own currencies will find it much harder to repay the dollar-denominated debt. In addition, capital flight out of emerging economies and into the US could cause rapid increases in interest rates for emerging market issuers. Issuers in the Energy sector, particularly the smaller and less creditworthy companies, will struggle to repay huge amounts of debt issued before the dollar surged and oil prices plummeted. At some point, these pressures could be felt throughout the global economy. The Fed's aggressive monetary easing has forced investors in risky assets. The unwinding of this process is unlikely to go smoothly. A higher dollar also has implications for US economic growth. Exports add to domestic GDP, while imports subtract. As the dollar falls, imports become cheaper relative to domestically produced goods and services. In 2014, an increase in the trade deficit subtracted 23 basis points from GDP growth. Most believe that figure will go much higher in 2015. Moreover, the rapid growth in imports associated with the dollar strength results in the US effectively "importing deflation" at a time when the Fed is trying to generate more inflation. In other words, the strong dollar is complicating matters for the Fed.
Where is much of the recent earnings growth coming from? Corporate buybacks. According to a March 4 article in The Wall Street Journal, "In the six full years following and including the financial-crisis nadir - so, 2009 through 2014 - a net of $41.2 billion has gone into equity funds, according to data from Lipper Funds. Meanwhile, in the first three quarters of 2014 alone, corporate buybacks rose 27%, to $567.2 billion." This is a stunning statistic. The article goes on to say that "buyback authorizations in February, at $118.32 billion, were the strongest for any February on record, according to data from Birinyi Associates." Should investors pay up for earnings growth generated through buybacks? So far they have, but this game of financial engineering is likely to lose its luster if for no other reason than stocks are no longer cheap. All else equal, buybacks are set to be meaningfully less accretive when executed at dramatically higher prices.
We've argued that earnings quality is a factor that has been underappreciated by investors during the course of this bull market. Corporate profit growth has benefited from several unsustainable factors, and margins that are running some 50% above long-term averages. We have also argued that there cannot be a complete "decoupling" between the US and the rest of the world. It appears as though the market is beginning to catch on to these notions. We continue to believe it makes most sense to own high-quality, conservative large-cap companies with fortress balance sheets and superior management teams. There is no wisdom in crawling onto the thinner branches if a storm is coming!
Peace,
Michael
http://farrmiller.com/
Monday, December 10, 2012
Defining a secular bear market - by Dr. John Hussman
One way to think about the effect of a secular bear market is to compare the absolute amount of volatility experienced by the market to the total distance it travels. In the chart below, the blue line represents the sum of absolute weekly percentage changes in the S&P 500 over the preceding 4-year period, divided by the absolute overall change in the S&P 500 over that period. A spike in that line indicates that the market experienced a great deal of week-to-week volatility over a 4-year period, without much net movement overall (Geek's note – this calculation is related to the concept of fractal dimension - the spikes are singularities where the ratio is undefined because the 4-year change is close to zero).
An extended period of blue spikes is the hallmark of secular bear markets. These periods have reliably followed periods of elevated valuations as we have observed, with little respite, since the late 1990s. A great deal of distance traveled, with little to show for it overall. Present valuations provide little reason to believe that this period is behind us. Things will change, and this period of distortion will be behind us. The transition is likely to be unpleasant for the market, but again, I expect that we'll observe good opportunities to accept significant market exposure even in the coming market cycle.

by Dr. John Hussman
December 10, 2012
Secular Bear Markets - Volatility Without Return
Subscribe to:
Posts (Atom)